Working with PDB Structures in DataFrames
Loading PDB Files
There are several ways to load a PDB structure into a PandasPdb object.
1 -- Loading a PDB file from the Protein Data Bank
PDB files can be directly fetched from The Protein Data Bank at http://www.rcsb.org via its unique 4-letter after initializing a new PandasPdb object and calling the fetch_pdb method:
from biopandas.pdb import PandasPdb

# Initialize a new PandasPdb object
# and fetch the PDB file from rcsb.org
ppdb = PandasPdb().fetch_pdb('3eiy')
2 -- Loading a PDB file from the AlphaFold Structure Database
(New in version 0.4.0)
PDB files can be directly fetched from The AlphaFold Structure Database at https://alphafold.ebi.ac.uk/ via its unique UniProt Identifier after initializing a new PandasPdb object and calling the fetch_af2 method:
from biopandas.pdb import PandasPdb

# Initialize a new PandasPdb object
# and fetch the PDB file from alphafold.ebi.ac.uk
ppdb = PandasPdb().fetch_pdb(uniprot_id='Q5VSL9', source="alphafold2-v2")
ppdb.df["ATOM"]
| record_name | atom_number | blank_1 | atom_name | ... | segment_id | element_symbol | charge | line_idx | |
|---|---|---|---|---|---|---|---|---|---|
| 0 | ATOM | 1 | N | ... | N | NaN | 111 | ||
| 1 | ATOM | 2 | CA | ... | C | NaN | 112 | ||
| 2 | ATOM | 3 | C | ... | C | NaN | 113 | ||
| 3 | ATOM | 4 | CB | ... | C | NaN | 114 | ||
| 4 | ATOM | 5 | O | ... | O | NaN | 115 | ||
| ... | ... | ... | ... | ... | ... | ... | ... | ... | ... |
| 6713 | ATOM | 6714 | CG | ... | C | NaN | 6824 | ||
| 6714 | ATOM | 6715 | CD | ... | C | NaN | 6825 | ||
| 6715 | ATOM | 6716 | NE2 | ... | N | NaN | 6826 | ||
| 6716 | ATOM | 6717 | OE1 | ... | O | NaN | 6827 | ||
| 6717 | ATOM | 6718 | OXT | ... | O | NaN | 6828 |
6718 rows × 21 columns
3 a) -- Loading a PDB structure from a local file
Alternatively, we can load PDB files from local directories as regular PDB files using read_pdb:
ppdb.read_pdb('./data/3eiy.pdb')
<biopandas.pdb.pandas_pdb.PandasPdb at 0x11c393a60>
[File link: 3eiy.pdb]
3 b) -- Loading a PDB structure from a local gzipped PDB file
Or, we can load them from gzip archives like so (note that the file must end with a '.gz' suffix in order to be recognized as a gzip file):
ppdb.read_pdb('./data/3eiy.pdb.gz')
<biopandas.pdb.pandas_pdb.PandasPdb at 0x11c393a60>
[File link: 3eiy.pdb.gz]
After the file was succesfully loaded, we have access to the following attributes:
print('PDB Code: %s' % ppdb.code)
print('PDB Header Line: %s' % ppdb.header)
print('\nRaw PDB file contents:\n\n%s\n...' % ppdb.pdb_text[:1000])
PDB Code: 3eiy
PDB Header Line:     HYDROLASE                               17-SEP-08   3EIY

Raw PDB file contents:

HEADER    HYDROLASE                               17-SEP-08   3EIY
TITLE     CRYSTAL STRUCTURE OF INORGANIC PYROPHOSPHATASE FROM BURKHOLDERIA
TITLE    2 PSEUDOMALLEI WITH BOUND PYROPHOSPHATE
COMPND    MOL_ID: 1;
COMPND   2 MOLECULE: INORGANIC PYROPHOSPHATASE;
COMPND   3 CHAIN: A;
COMPND   4 EC: 3.6.1.1;
COMPND   5 ENGINEERED: YES
SOURCE    MOL_ID: 1;
SOURCE   2 ORGANISM_SCIENTIFIC: BURKHOLDERIA PSEUDOMALLEI 1710B;
SOURCE   3 ORGANISM_TAXID: 320372;
SOURCE   4 GENE: PPA, BURPS1710B_1237;
SOURCE   5 EXPRESSION_SYSTEM
...
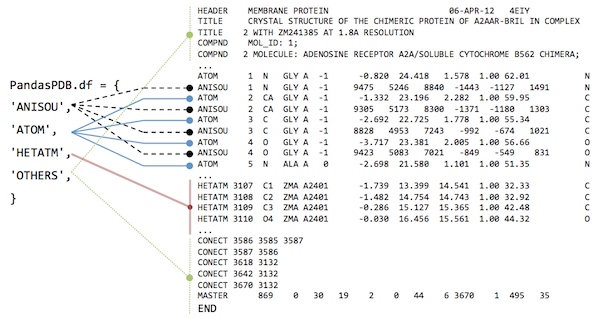
The most interesting / useful attribute is the PandasPdb.df DataFrame dictionary though, which gives us access to the PDB files as pandas DataFrames. Let's print the first 3 lines from the ATOM coordinate section to see how it looks like:
ppdb.df['ATOM'].head(3)
| record_name | atom_number | blank_1 | atom_name | ... | segment_id | element_symbol | charge | line_idx | |
|---|---|---|---|---|---|---|---|---|---|
| 0 | ATOM | 1 | N | ... | N | NaN | 609 | ||
| 1 | ATOM | 2 | CA | ... | C | NaN | 610 | ||
| 2 | ATOM | 3 | C | ... | C | NaN | 611 |
3 rows × 21 columns
But more on that in the next section.
4 -- Loading a PDB file from a Python list
Since biopandas 0.3.0, PDB files can also be loaded into a PandasPdb object from a Python list:
with open('./data/3eiy.pdb', 'r') as f:
    three_eiy = f.readlines()

ppdb2 = PandasPdb()
ppdb2.read_pdb_from_list(three_eiy)

ppdb2.df['ATOM'].head()
| record_name | atom_number | blank_1 | atom_name | ... | segment_id | element_symbol | charge | line_idx | |
|---|---|---|---|---|---|---|---|---|---|
| 0 | ATOM | 1 | N | ... | N | NaN | 609 | ||
| 1 | ATOM | 2 | CA | ... | C | NaN | 610 | ||
| 2 | ATOM | 3 | C | ... | C | NaN | 611 | ||
| 3 | ATOM | 4 | O | ... | O | NaN | 612 | ||
| 4 | ATOM | 5 | CB | ... | C | NaN | 613 |
5 rows × 21 columns
5 -- Obtaining a PDB file from a mmCIF structure
Since v0.5.0, it is now also possible to obtain a PandasPdb object from a mmCIF file, using PandasMmcift's PandasMmcif.get_pandas_pdb():
from biopandas.mmcif import PandasMmcif


mmcif = PandasMmcif().fetch_mmcif("3EIY")
pdb = mmcif.convert_to_pandas_pdb()

print("Type:", type(pdb))
pdb.df["ATOM"].head()
Type: <class 'biopandas.pdb.pandas_pdb.PandasPdb'>
| record_name | atom_number | blank_1 | atom_name | alt_loc | residue_name | blank_2 | chain_id | residue_number | insertion | ... | x_coord | y_coord | z_coord | occupancy | b_factor | blank_4 | segment_id | element_symbol | charge | line_idx | |
|---|---|---|---|---|---|---|---|---|---|---|---|---|---|---|---|---|---|---|---|---|---|
| 0 | ATOM | 1 | N | SER | A | 2 | ... | 2.527 | 54.656 | -1.667 | 1.0 | 52.73 | N | NaN | 0 | ||||||
| 1 | ATOM | 2 | CA | SER | A | 2 | ... | 3.259 | 54.783 | -0.368 | 1.0 | 52.54 | C | NaN | 1 | ||||||
| 2 | ATOM | 3 | C | SER | A | 2 | ... | 4.127 | 53.553 | -0.105 | 1.0 | 52.03 | C | NaN | 2 | ||||||
| 3 | ATOM | 4 | O | SER | A | 2 | ... | 5.274 | 53.451 | -0.594 | 1.0 | 52.45 | O | NaN | 3 | ||||||
| 4 | ATOM | 5 | CB | SER | A | 2 | ... | 2.273 | 54.944 | 0.792 | 1.0 | 52.69 | C | NaN | 4 |
5 rows × 21 columns
Looking at PDBs in DataFrames
PDB files are parsed according to the PDB file format description. More specifically, BioPandas reads the columns of the ATOM and HETATM sections as shown in the following excerpt from http://deposit.rcsb.org/adit/docs/pdb_atom_format.html#ATOM.
| COLUMNS | DATA TYPE | CONTENTS | biopandas column name |
|---|---|---|---|
| 1 - 6 | Record name | "ATOM" | record_name |
| 7 - 11 | Integer | Atom serial number. | atom_number |
| 12 | blank_1 | ||
| 13 - 16 | Atom | Atom name. | atom_name |
| 17 | Character | Alternate location indicator. | alt_loc |
| 18 - 20 | Residue name | Residue name. | residue_name |
| 21 | blank_2 | ||
| 22 | Character | Chain identifier. | chain_id |
| 23 - 26 | Integer | Residue sequence number. | residue_number |
| 27 | AChar | Code for insertion of residues. | insertion |
| 28 - 30 | blank_3 | ||
| 31 - 38 | Real(8.3) | Orthogonal coordinates for X in Angstroms. | x_coord |
| 39 - 46 | Real(8.3) | Orthogonal coordinates for Y in Angstroms. | y_coord |
| 47 - 54 | Real(8.3) | Orthogonal coordinates for Z in Angstroms. | z_coord |
| 55 - 60 | Real(6.2) | Occupancy. | occupancy |
| 61 - 66 | Real(6.2) | Temperature factor (Default = 0.0). | bfactor |
| 67-72 | blank_4 | ||
| 73 - 76 | LString(4) | Segment identifier, left-justified. | segment_id |
| 77 - 78 | LString(2) | Element symbol, right-justified. | element_symbol |
| 79 - 80 | LString(2) | Charge on the atom. | charge |
Below is an example of how this would look like in an actual PDB file:
Example:
         1         2         3         4         5         6         7         8
12345678901234567890123456789012345678901234567890123456789012345678901234567890
ATOM    145  N   VAL A  25      32.433  16.336  57.540  1.00 11.92      A1   N
ATOM    146  CA  VAL A  25      31.132  16.439  58.160  1.00 11.85      A1   C
ATOM    147  C   VAL A  25      30.447  15.105  58.363  1.00 12.34      A1   C
ATOM    148  O   VAL A  25      29.520  15.059  59.174  1.00 15.65      A1   O
ATOM    149  CB AVAL A  25      30.385  17.437  57.230  0.28 13.88      A1   C
ATOM    150  CB BVAL A  25      30.166  17.399  57.373  0.72 15.41      A1   C
ATOM    151  CG1AVAL A  25      28.870  17.401  57.336  0.28 12.64      A1   C
ATOM    152  CG1BVAL A  25      30.805  18.788  57.449  0.72 15.11      A1   C
ATOM    153  CG2AVAL A  25      30.835  18.826  57.661  0.28 13.58      A1   C
ATOM    154  CG2BVAL A  25      29.909  16.996  55.922  0.72 13.25      A1   C
After loading a PDB file from rcsb.org or our local drive, the PandasPdb.df attribute should contain the following 4 DataFrame objects:
from biopandas.pdb import PandasPdb
ppdb = PandasPdb()
ppdb.read_pdb('./data/3eiy.pdb')
ppdb.df.keys()
dict_keys(['ATOM', 'HETATM', 'ANISOU', 'OTHERS'])
[File link: 3eiy.pdb]
- 'ATOM': contains the entries from the ATOM coordinate section
- 'HETATM': ... entries from the "HETATM" coordinate section
- 'ANISOU': ... entries from the "ANISOU" coordinate section
- 'OTHERS': Everything else that is not a 'ATOM', 'HETATM', or 'ANISOU' entry
The columns of the 'HETATM' DataFrame are indentical to the 'ATOM' DataFrame that we've seen earlier:
ppdb.df['HETATM'].head(2)
| record_name | atom_number | blank_1 | atom_name | ... | segment_id | element_symbol | charge | line_idx | |
|---|---|---|---|---|---|---|---|---|---|
| 0 | HETATM | 1332 | K | ... | K | NaN | 1940 | ||
| 1 | HETATM | 1333 | NA | ... | NA | NaN | 1941 |
2 rows × 21 columns
Note that "ANISOU" entries are handled a bit differently as specified at http://deposit.rcsb.org/adit/docs/pdb_atom_format.html#ATOM.
ppdb.df['ANISOU'].head(2)
| record_name | atom_number | blank_1 | atom_name | ... | blank_4 | element_symbol | charge | line_idx |
|---|
0 rows × 21 columns
Not every PDB file contains ANISOU entries (similarly, some PDB files may only contain HETATM or ATOM entries). If records are basent, the DataFrame will be empty as show above.
ppdb.df['ANISOU'].empty
True
Since the DataFrames are fairly wide, let's us take a look at the columns by accessing the DataFrame's column attribute:
ppdb.df['ANISOU'].columns
Index(['record_name', 'atom_number', 'blank_1', 'atom_name', 'alt_loc', 'residue_name', 'blank_2', 'chain_id', 'residue_number', 'insertion', 'blank_3', 'U(1,1)', 'U(2,2)', 'U(3,3)', 'U(1,2)', 'U(1,3)', 'U(2,3)', 'blank_4', 'element_symbol', 'charge', 'line_idx'], dtype='object')
ANISOU records are very similar to ATOM/HETATM records. In fact, the columns 7 - 27 and 73 - 80 are identical to their corresponding ATOM/HETATM records, which means that the 'ANISOU' DataFrame doesn't have the following entries:
set(ppdb.df['ATOM'].columns).difference(set(ppdb.df['ANISOU'].columns))
{'b_factor', 'occupancy', 'segment_id', 'x_coord', 'y_coord', 'z_coord'}
Instead, the "ANISOU" DataFrame contains the anisotropic temperature factors "U(-,-)" -- note that these are scaled by a factor of () by convention.
set(ppdb.df['ANISOU'].columns).difference(set(ppdb.df['ATOM'].columns))
{'U(1,1)', 'U(1,2)', 'U(1,3)', 'U(2,2)', 'U(2,3)', 'U(3,3)'}
Ah, another interesting thing to mention is that the columns already come with the types you'd expect (where object essentially "means" str here):
ppdb.df['ATOM'].dtypes
record_name        object
atom_number         int64
blank_1            object
atom_name          object
alt_loc            object
residue_name       object
blank_2            object
chain_id           object
residue_number      int64
insertion          object
blank_3            object
x_coord           float64
y_coord           float64
z_coord           float64
occupancy         float64
b_factor          float64
blank_4            object
segment_id         object
element_symbol     object
charge            float64
line_idx            int64
dtype: object
Typically, all good things come in threes, however, there is a 4th DataFrame, an'OTHER' DataFrame, which contains everything that wasn't parsed as 'ATOM', 'HETATM', or 'ANISOU' coordinate section:
ppdb.df['OTHERS'].head(5)
| record_name | entry | line_idx | |
|---|---|---|---|
| 0 | HEADER | HYDROLASE 17... | 0 |
| 1 | TITLE | CRYSTAL STRUCTURE OF INORGANIC PYROPHOSPHA... | 1 |
| 2 | TITLE | 2 PSEUDOMALLEI WITH BOUND PYROPHOSPHATE | 2 |
| 3 | COMPND | MOL_ID: 1; | 3 |
| 4 | COMPND | 2 MOLECULE: INORGANIC PYROPHOSPHATASE; | 4 |
Although these 'OTHER' entries are typically less useful for structure-related computations, you may still want to take a look at them to get a short summary of the PDB structure and learn about it's potential quirks and gotchas (typically listed in the REMARKs section). Lastly, the "OTHERS" DataFrame comes in handy if we want to reconstruct the structure as PDB file as we will see later (note the line_idx columns in all of the DataFrames).
Working with PDB DataFrames
In the previous sections, we've seen how to load PDB structures into DataFrames, and how to access them. Now, let's talk about manipulating PDB files in DataFrames.
from biopandas.pdb import PandasPdb
ppdb = PandasPdb()
ppdb.read_pdb('./data/3eiy.pdb.gz')
ppdb.df['ATOM'].head()
| record_name | atom_number | blank_1 | atom_name | ... | segment_id | element_symbol | charge | line_idx | |
|---|---|---|---|---|---|---|---|---|---|
| 0 | ATOM | 1 | N | ... | N | NaN | 609 | ||
| 1 | ATOM | 2 | CA | ... | C | NaN | 610 | ||
| 2 | ATOM | 3 | C | ... | C | NaN | 611 | ||
| 3 | ATOM | 4 | O | ... | O | NaN | 612 | ||
| 4 | ATOM | 5 | CB | ... | C | NaN | 613 |
5 rows × 21 columns
[File link: 3eiy.pdb.gz]
Okay, there's actually not that much to say ...
Once we have our PDB file in the DataFrame format, we have the whole convenience of pandas right there at our fingertips.
For example, let's get all Proline residues:
ppdb.df['ATOM'][ppdb.df['ATOM']['residue_name'] == 'PRO'].head()
| record_name | atom_number | blank_1 | atom_name | ... | segment_id | element_symbol | charge | line_idx | |
|---|---|---|---|---|---|---|---|---|---|
| 38 | ATOM | 39 | N | ... | N | NaN | 647 | ||
| 39 | ATOM | 40 | CA | ... | C | NaN | 648 | ||
| 40 | ATOM | 41 | C | ... | C | NaN | 649 | ||
| 41 | ATOM | 42 | O | ... | O | NaN | 650 | ||
| 42 | ATOM | 43 | CB | ... | C | NaN | 651 |
5 rows × 21 columns
Or main chain atoms:
ppdb.df['ATOM'][ppdb.df['ATOM']['atom_name'] == 'C'].head()
| record_name | atom_number | blank_1 | atom_name | ... | segment_id | element_symbol | charge | line_idx | |
|---|---|---|---|---|---|---|---|---|---|
| 2 | ATOM | 3 | C | ... | C | NaN | 611 | ||
| 8 | ATOM | 9 | C | ... | C | NaN | 617 | ||
| 19 | ATOM | 20 | C | ... | C | NaN | 628 | ||
| 25 | ATOM | 26 | C | ... | C | NaN | 634 | ||
| 33 | ATOM | 34 | C | ... | C | NaN | 642 |
5 rows × 21 columns
It's also easy to strip our coordinate section from hydrogen atoms if there are any ...
ppdb.df['ATOM'][ppdb.df['ATOM']['element_symbol'] != 'H'].head()
| record_name | atom_number | blank_1 | atom_name | ... | segment_id | element_symbol | charge | line_idx | |
|---|---|---|---|---|---|---|---|---|---|
| 0 | ATOM | 1 | N | ... | N | NaN | 609 | ||
| 1 | ATOM | 2 | CA | ... | C | NaN | 610 | ||
| 2 | ATOM | 3 | C | ... | C | NaN | 611 | ||
| 3 | ATOM | 4 | O | ... | O | NaN | 612 | ||
| 4 | ATOM | 5 | CB | ... | C | NaN | 613 |
5 rows × 21 columns
Or, let's compute the average temperature factor of our protein main chain:
mainchain = ppdb.df['ATOM'][(ppdb.df['ATOM']['atom_name'] == 'C') |
                            (ppdb.df['ATOM']['atom_name'] == 'O') |
                            (ppdb.df['ATOM']['atom_name'] == 'N') |
                            (ppdb.df['ATOM']['atom_name'] == 'CA')]

bfact_mc_avg = mainchain['b_factor'].mean()
print('Average B-Factor [Main Chain]: %.2f' % bfact_mc_avg)
Average B-Factor [Main Chain]: 28.83
Loading PDB files from a Python List
Since biopandas 0.3.0, PDB files can also be loaded into a PandasPdb object from a Python list:
with open('./data/3eiy.pdb', 'r') as f:
    three_eiy = f.readlines()

ppdb2 = PandasPdb()
ppdb2.read_pdb_from_list(three_eiy)

ppdb2.df['ATOM'].head()
| record_name | atom_number | blank_1 | atom_name | ... | segment_id | element_symbol | charge | line_idx | |
|---|---|---|---|---|---|---|---|---|---|
| 0 | ATOM | 1 | N | ... | N | NaN | 609 | ||
| 1 | ATOM | 2 | CA | ... | C | NaN | 610 | ||
| 2 | ATOM | 3 | C | ... | C | NaN | 611 | ||
| 3 | ATOM | 4 | O | ... | O | NaN | 612 | ||
| 4 | ATOM | 5 | CB | ... | C | NaN | 613 |
5 rows × 21 columns
Working with PDBs Containing Multiple Models
(New in version 0.4.0)
Some PDB files, particularly those containing NMR structures, provide an ensemble of models. There are various ways to extract these.
In these examples we will work with 2JYF: an RNA structure containing 10 models of the same underlying RNA structure.
To start, we con obtain a DataFrame denoting the lines of the PDB files corresponding to each model.
from biopandas.pdb import PandasPdb

ppdb = PandasPdb().read_pdb('./data/2jyf.pdb')
ppdb.get_model_start_end()
/Users/sebastian/Desktop/biopandas/biopandas/pdb/pandas_pdb.py:680: SettingWithCopyWarning:
A value is trying to be set on a copy of a slice from a DataFrame.
Try using .loc[row_indexer,col_indexer] = value instead

See the caveats in the documentation: https://pandas.pydata.org/pandas-docs/stable/user_guide/indexing.html#returning-a-view-versus-a-copy
  idxs["end_idx"] = ends.line_idx.values
| record_name | model_idx | start_idx | end_idx | |
|---|---|---|---|---|
| 129 | MODEL | 1 | 129 | 2896 |
| 133 | MODEL | 2 | 2897 | 5664 |
| 137 | MODEL | 3 | 5665 | 8432 |
| 141 | MODEL | 4 | 8433 | 11200 |
| 145 | MODEL | 5 | 11201 | 13968 |
| 149 | MODEL | 6 | 13969 | 16736 |
| 153 | MODEL | 7 | 16737 | 19504 |
| 157 | MODEL | 8 | 19505 | 22272 |
| 161 | MODEL | 9 | 22273 | 25040 |
| 165 | MODEL | 10 | 25041 | 27808 |
Assigning model IDs to the PDB DataFrames
For ease of use, the label_models() method adds an additional column, "model_id" to the dataframes contained within the PandasPdb object.
from biopandas.pdb import PandasPdb
ppdb = PandasPdb().read_pdb('./data/2jyf.pdb')

ppdb.label_models()
ppdb.df["ATOM"]["model_id"]
/Users/sebastian/Desktop/biopandas/biopandas/pdb/pandas_pdb.py:680: SettingWithCopyWarning:
A value is trying to be set on a copy of a slice from a DataFrame.
Try using .loc[row_indexer,col_indexer] = value instead

See the caveats in the documentation: https://pandas.pydata.org/pandas-docs/stable/user_guide/indexing.html#returning-a-view-versus-a-copy
  idxs["end_idx"] = ends.line_idx.values


0         1
1         1
2         1
3         1
4         1
         ..
27635    10
27636    10
27637    10
27638    10
27639    10
Name: model_id, Length: 27640, dtype: int64
Subsetting PandasPdb objects to a given model
We can obtain new PandasPdb objects containing only a given model using the get_model() method
from biopandas.pdb import PandasPdb
ppdb = PandasPdb().read_pdb('./data/2jyf.pdb')

model_4 = ppdb.get_model(model_index=4)
model_4.df["ATOM"]
/Users/sebastian/Desktop/biopandas/biopandas/pdb/pandas_pdb.py:680: SettingWithCopyWarning:
A value is trying to be set on a copy of a slice from a DataFrame.
Try using .loc[row_indexer,col_indexer] = value instead

See the caveats in the documentation: https://pandas.pydata.org/pandas-docs/stable/user_guide/indexing.html#returning-a-view-versus-a-copy
  idxs["end_idx"] = ends.line_idx.values
| record_name | atom_number | blank_1 | atom_name | ... | element_symbol | charge | line_idx | model_id | |
|---|---|---|---|---|---|---|---|---|---|
| 8292 | ATOM | 1 | O5' | ... | O | NaN | 8434 | 4 | |
| 8293 | ATOM | 2 | C5' | ... | C | NaN | 8435 | 4 | |
| 8294 | ATOM | 3 | C4' | ... | C | NaN | 8436 | 4 | |
| 8295 | ATOM | 4 | O4' | ... | O | NaN | 8437 | 4 | |
| 8296 | ATOM | 5 | C3' | ... | C | NaN | 8438 | 4 | |
| ... | ... | ... | ... | ... | ... | ... | ... | ... | ... |
| 11051 | ATOM | 2761 | HO2' | ... | H | NaN | 11194 | 4 | |
| 11052 | ATOM | 2762 | H1' | ... | H | NaN | 11195 | 4 | |
| 11053 | ATOM | 2763 | H3 | ... | H | NaN | 11196 | 4 | |
| 11054 | ATOM | 2764 | H5 | ... | H | NaN | 11197 | 4 | |
| 11055 | ATOM | 2765 | H6 | ... | H | NaN | 11198 | 4 |
2764 rows × 22 columns
Subsetting PandasPdb objects to a list of given models
We can obtain new PandasPdb objects containing only a given models using the get_models() method
from biopandas.pdb import PandasPdb
ppdb = PandasPdb().read_pdb('./data/2jyf.pdb')

model_ensemble = ppdb.get_models(model_indices=[2, 4, 6, 8])
model_ensemble.df["ATOM"]
/Users/sebastian/Desktop/biopandas/biopandas/pdb/pandas_pdb.py:680: SettingWithCopyWarning:
A value is trying to be set on a copy of a slice from a DataFrame.
Try using .loc[row_indexer,col_indexer] = value instead

See the caveats in the documentation: https://pandas.pydata.org/pandas-docs/stable/user_guide/indexing.html#returning-a-view-versus-a-copy
  idxs["end_idx"] = ends.line_idx.values
| record_name | atom_number | blank_1 | atom_name | ... | element_symbol | charge | line_idx | model_id | |
|---|---|---|---|---|---|---|---|---|---|
| 2764 | ATOM | 1 | O5' | ... | O | NaN | 2898 | 2 | |
| 2765 | ATOM | 2 | C5' | ... | C | NaN | 2899 | 2 | |
| 2766 | ATOM | 3 | C4' | ... | C | NaN | 2900 | 2 | |
| 2767 | ATOM | 4 | O4' | ... | O | NaN | 2901 | 2 | |
| 2768 | ATOM | 5 | C3' | ... | C | NaN | 2902 | 2 | |
| ... | ... | ... | ... | ... | ... | ... | ... | ... | ... |
| 22107 | ATOM | 2761 | HO2' | ... | H | NaN | 22266 | 8 | |
| 22108 | ATOM | 2762 | H1' | ... | H | NaN | 22267 | 8 | |
| 22109 | ATOM | 2763 | H3 | ... | H | NaN | 22268 | 8 | |
| 22110 | ATOM | 2764 | H5 | ... | H | NaN | 22269 | 8 | |
| 22111 | ATOM | 2765 | H6 | ... | H | NaN | 22270 | 8 |
11056 rows × 22 columns
Plotting
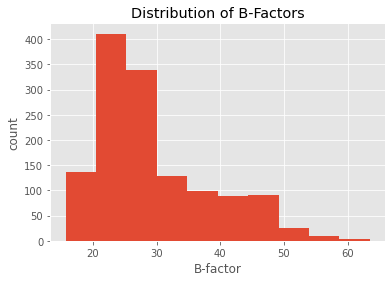
Since we are using pandas under the hood, which in turns uses matplotlib under the hood, we can produce quick summary plots of our PDB structures relatively conveniently:
from biopandas.pdb import PandasPdb
ppdb = PandasPdb().read_pdb('./data/3eiy.pdb.gz')
[File link: 3eiy.pdb.gz]
%matplotlib inline
import matplotlib.pyplot as plt
from matplotlib import style
style.use('ggplot')
ppdb.df['ATOM']['b_factor'].plot(kind='hist')
plt.title('Distribution of B-Factors')
plt.xlabel('B-factor')
plt.ylabel('count')
plt.show()
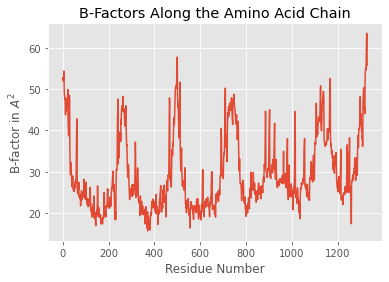
ppdb.df['ATOM']['b_factor'].plot(kind='line')
plt.title('B-Factors Along the Amino Acid Chain')
plt.xlabel('Residue Number')
plt.ylabel('B-factor in $A^2$')
plt.show()
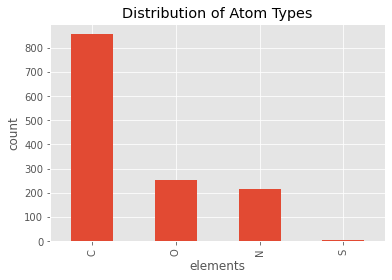
ppdb.df['ATOM']['element_symbol'].value_counts().plot(kind='bar')
plt.title('Distribution of Atom Types')
plt.xlabel('elements')
plt.ylabel('count')
plt.show()
Computing the Root Mean Square Deviation
BioPandas also comes with certain convenience functions, for example, ...
The Root-mean-square deviation (RMSD) is simply a measure of the average distance between atoms of 2 protein or ligand structures. This calculation of the Cartesian error follows the equation:
So, assuming that the we have the following 2 conformations of a ligand molecule
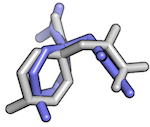
we can compute the RMSD as follows:
from biopandas.pdb import PandasPdb

l_1 = PandasPdb().read_pdb('./data/lig_conf_1.pdb')
l_2 = PandasPdb().read_pdb('./data/lig_conf_2.pdb')
r = PandasPdb.rmsd(l_1.df['HETATM'], l_2.df['HETATM'],
                   s=None) # all atoms, including hydrogens
print('RMSD: %.4f Angstrom' % r)
RMSD: 2.6444 Angstrom
l_1.df['HETATM']
| record_name | atom_number | blank_1 | atom_name | ... | segment_id | element_symbol | charge | line_idx | |
|---|---|---|---|---|---|---|---|---|---|
| 0 | HETATM | 1 | C1 | ... | C | NaN | 0 | ||
| 1 | HETATM | 2 | O1 | ... | O | NaN | 1 | ||
| 2 | HETATM | 3 | C2 | ... | C | NaN | 2 | ||
| 3 | HETATM | 4 | O2 | ... | O | NaN | 3 | ||
| 4 | HETATM | 5 | C3 | ... | C | NaN | 4 | ||
| 5 | HETATM | 6 | O3 | ... | O | NaN | 5 | ||
| 6 | HETATM | 7 | C4 | ... | C | NaN | 6 | ||
| 7 | HETATM | 8 | O4 | ... | O | NaN | 7 | ||
| 8 | HETATM | 9 | C5 | ... | C | NaN | 8 | ||
| 9 | HETATM | 10 | O5 | ... | O | NaN | 9 | ||
| 10 | HETATM | 11 | C6 | ... | C | NaN | 10 | ||
| 11 | HETATM | 12 | O6 | ... | O | NaN | 11 | ||
| 12 | HETATM | 13 | C7 | ... | C | NaN | 12 | ||
| 13 | HETATM | 14 | C8 | ... | C | NaN | 13 | ||
| 14 | HETATM | 15 | C9 | ... | C | NaN | 14 | ||
| 15 | HETATM | 16 | C10 | ... | C | NaN | 15 | ||
| 16 | HETATM | 17 | H1 | ... | H | NaN | 16 | ||
| 17 | HETATM | 18 | H2 | ... | H | NaN | 17 | ||
| 18 | HETATM | 19 | H3 | ... | H | NaN | 18 | ||
| 19 | HETATM | 20 | H4 | ... | H | NaN | 19 | ||
| 20 | HETATM | 21 | H5 | ... | H | NaN | 20 | ||
| 21 | HETATM | 22 | H6 | ... | H | NaN | 21 | ||
| 22 | HETATM | 23 | H7 | ... | H | NaN | 22 | ||
| 23 | HETATM | 24 | H8 | ... | H | NaN | 23 |
24 rows × 21 columns
[File links: lig_conf_1.pdb, lig_conf_2.pdb]
r = PandasPdb.rmsd(l_1.df['HETATM'], l_2.df['HETATM'],
                   s='carbon') # carbon atoms only
print('RMSD: %.4f Angstrom' % r)
RMSD: 1.7249 Angstrom
r = PandasPdb.rmsd(l_1.df['HETATM'], l_2.df['HETATM'],
                   s='heavy') # heavy atoms only
print('RMSD: %.4f Angstrom' % r)
RMSD: 1.9959 Angstrom
Similarly, we can compute the RMSD between 2 related protein structures:
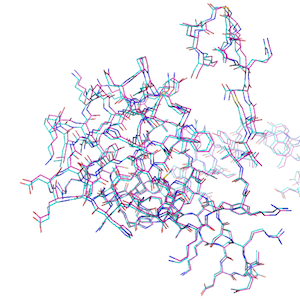
The hydrogen-free RMSD:
p_1 = PandasPdb().read_pdb('./data/1t48_995.pdb')
p_2 = PandasPdb().read_pdb('./data/1t49_995.pdb')
r = PandasPdb.rmsd(p_1.df['ATOM'], p_2.df['ATOM'], s='heavy')
print('RMSD: %.4f Angstrom' % r)
RMSD: 0.7377 Angstrom
Or the RMSD between the main chains only:
p_1 = PandasPdb().read_pdb('./data/1t48_995.pdb')
p_2 = PandasPdb().read_pdb('./data/1t49_995.pdb')
r = PandasPdb.rmsd(p_1.df['ATOM'], p_2.df['ATOM'], s='main chain')
print('RMSD: %.4f Angstrom' % r)
RMSD: 0.4781 Angstrom
Filtering PDBs by Distance
We can use the distance method to compute the distance between each atom (or a subset of atoms) in our data frame and a three-dimensional reference point. For example:
p_1 = PandasPdb().read_pdb('./data/3eiy.pdb')

reference_point = (9.362, 41.410, 10.542)
distances = p_1.distance(xyz=reference_point, records=('ATOM',))
[File link: 3eiy.pdb]
The distance method returns a Pandas Series object:
distances.head()
0    19.267419
1    18.306060
2    16.976934
3    16.902897
4    18.124171
dtype: float64
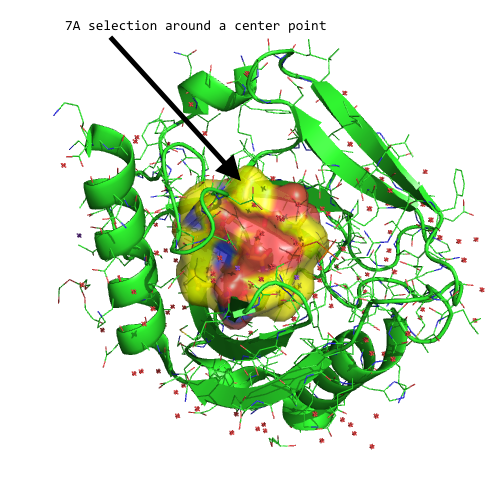
And we can use this Series object, for instance, to select certain atoms in our DataFrame that fall within a desired distance threshold. For example, let's select all atoms that are within 7A of our reference point:
all_within_7A = p_1.df['ATOM'][distances < 7.0]
all_within_7A.tail()
| record_name | atom_number | blank_1 | atom_name | ... | segment_id | element_symbol | charge | line_idx | |
|---|---|---|---|---|---|---|---|---|---|
| 786 | ATOM | 787 | CB | ... | C | NaN | 1395 | ||
| 787 | ATOM | 788 | CG | ... | C | NaN | 1396 | ||
| 788 | ATOM | 789 | CD1 | ... | C | NaN | 1397 | ||
| 789 | ATOM | 790 | CD2 | ... | C | NaN | 1398 | ||
| 790 | ATOM | 791 | N | ... | N | NaN | 1399 |
5 rows × 21 columns
Visualized in PyMOL, this subset (yellow surface) would look as follows:
Converting Amino Acid codes from 3- to 1-letter codes
Residues in the residue_name field can be converted into 1-letter amino acid codes, which may be useful for further sequence analysis, for example, pair-wise or multiple sequence alignments:
from biopandas.pdb import PandasPdb
ppdb = PandasPdb().fetch_pdb('5mtn')
sequence = ppdb.amino3to1()
sequence.tail()
| chain_id | residue_name | |
|---|---|---|
| 1378 | B | I |
| 1386 | B | N |
| 1394 | B | Y |
| 1406 | B | R |
| 1417 | B | T |
As shown above, the amino3to1 method returns a DataFrame containing the chain_id and residue_name of the translated 1-letter amino acids. If you like to work with the sequence as a Python list of string characters, you could do the following:
sequence_list = list(sequence.loc[sequence['chain_id'] == 'A', 'residue_name'])
sequence_list[-5:] # last 5 residues of chain A
['V', 'R', 'H', 'Y', 'T']
And if you prefer to work with the sequence as a string, you can use the join method:
''.join(sequence.loc[sequence['chain_id'] == 'A', 'residue_name'])
'SLEPEPWFFKNLSRKDAERQLLAPGNTHGSFLIRESESTAGSFSLSVRDFDQGEVVKHYKIRNLDNGGFYISPRITFPGLHELVRHYT'
To iterate over the sequences of multi-chain proteins, you can use the unique method as shown below:
for chain_id in sequence['chain_id'].unique():
    print('\nChain ID: %s' % chain_id)
    print(''.join(sequence.loc[sequence['chain_id'] == chain_id, 'residue_name']))
Chain ID: A
SLEPEPWFFKNLSRKDAERQLLAPGNTHGSFLIRESESTAGSFSLSVRDFDQGEVVKHYKIRNLDNGGFYISPRITFPGLHELVRHYT

Chain ID: B
SVSSVPTKLEVVAATPTSLLISWDAPAVTVVYYLITYGETGSPWPGGQAFEVPGSKSTATISGLKPGVDYTITVYAHRSSYGYSENPISINYRT
Wrapping it up - Saving PDB structures
Finally, let's talk about how to get the PDB structures out of the DataFrame format back into the beloved .pdb format.
Let's say we loaded a PDB structure, removed it from its hydrogens:
from biopandas.pdb import PandasPdb
ppdb = PandasPdb().read_pdb('./data/3eiy.pdb.gz')
ppdb.df['ATOM'] = ppdb.df['ATOM'][ppdb.df['ATOM']['element_symbol'] != 'H']
[File link: 3eiy.pdb.gz]
We can save the file using the PandasPdb.to_pdb method:
ppdb.to_pdb(path='./data/3eiy_stripped.pdb',
            records=None,
            gz=False,
            append_newline=True)
[File link: 3eiy_stripped.pdb]
By default, all records (that is, 'ATOM', 'HETATM', 'OTHERS', 'ANISOU') are written if we set records=None. Alternatively, let's say we want to get rid of the 'ANISOU' entries and produce a compressed gzip archive of our PDB structure:
ppdb.to_pdb(path='./data/3eiy_stripped.pdb.gz',
            records=['ATOM', 'HETATM', 'OTHERS'],
            gz=True,
            append_newline=True)
[File link: 3eiy_stripped.pdb.gz]